What the Average Volume of a Stock Tells You About How Easy It is to Offload
Understanding Stock Volume: the heart of stock price movement...
It's important that you know whatstock volume is because it either supports or denies the legitimacy of price action. Volume can often make or break your trade.
Stock volume is a measure of the number of stock shares that have been exchanged or traded within a specific period of time.
It's essentially how much buying and selling was going on within that period of time.
For instance, if we are looking at a daily chart of IBM and the volume bar shows 25,000,000 or 25M, that means that 25,000,000 shares of IBM stock was traded during the day.
Volume can be plotted as a line, but is usually plotted horizontally as a histogram along the bottom of the stock chart. It can also be plotted on top of prices.
For the particular style of trading I'm sharing with you, we are going to use stock volume intermittently.
For certain trades it will be absolutely necessary for volume to behave in a certain way before you enter the trade. However, with most of your trades you're merely going to note how volume is behaving before you enter the trade.
What Can Stock Volume Tell Us?
I consider price to be the mind of the market (I want to go up, or I want to go down). And volume is the heart of the market (I really want to go up, or I really want to go down).
Volume measures the commitment behind stock price movement. It lets you know how many people are involved in that move.
If a stock moves on low volume then that means that relatively few people are participating in this movement. And if a stock moves on high volume then many traders or investors are involved in that movement and it will be easier to find someone to buy from or sell to.
Volume tells us the emotional excitement (or lack thereof) in a stock.
There are many volume patterns that one can learn. However, I'm only going to show you four common ones. Think of patterns as messages. When you see a particular volume pattern, you more or less are going to ask yourself, "What message is this telling me?"
Stock Volume at the Start of a New Trend...
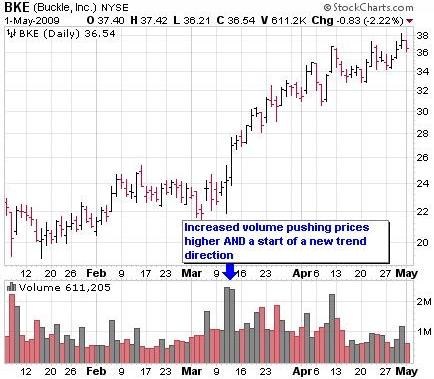
When you have increased volume pushing prices higher (or lower) the message here is "usually" that there is a lot of support for the current price movement, and it's likely to continue.

This pattern (message) is more reliable if it happens at the start of a new trend. If the trend has already been established for quite some time, then beware of a spike in volume.
Volume During an Already Existing Trend...
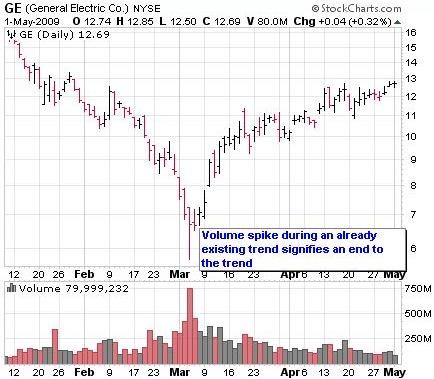
If a trend has already been established for some time and you have a spike in volume, it may be a sign that the trend is about to change. Not always, but sometimes.

Stock Volume and Price Divergence (disagreement)
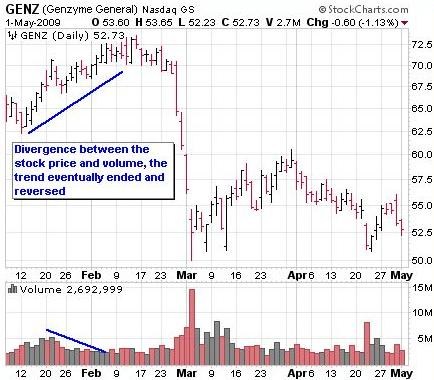
When you have decreased volume pushing prices higher (or lower) the message here is "usually" that there is little support for the current price movement, and the trend has a low likelihood of continuing.

For our example above the stock is trading higher on low volume. This may be a sign of uncertainty and the gains may be short lived. Without the conformation of volume it's very difficult to be sure of any price move or new trend.
Do Stock Volume Patterns Always Work?
All stock price movement and volume patterns work together to paint a picture. The interpretation of that picture is entirely up to you.
Traders often rely on patterns because they are assumed to increase the chances of success.
However, do not treat them as the law. They are "rules of thumb."
The reason you should not treat them as law is because often times you will see prices trend on heavy volume and NOT continue in that direction.
Remember buyers and sellers rule the market not technical indicators. At any time buyers and sellers can change their mind and cause the stock to move in an unexpected way and render your pattern completely useless.
Looking at stock volume patterns alone will not take you where you need to go. And no computer has ever been developed that can take in all the data and spit out winning trades.
You have to use your mind and your own human judgment.
As you look at charts please get used to looking at what volume is doing in relation to price. Stock volume is one of the primary indicators of confirmation. Volume either supports or denies the legitimacy of price action.
Now that you have a basic understanding of stock charts it's time to learn about technical indicators. Technical indicators can be used to help you enter and exit trades.
Proceed to Module 5: "Technical indicators".
If You're Looking For A Reliable Lower Risk Way To Be
Profitable With Options, Try The "Buffett Strategy"...
I don't know what has brought you to my page. Maybe you are interested in options to help youreduce the risk of your other stock market holdings.
Maybe you are looking for a way to generate a little additionalincome for retirement. Or maybe you've just heard about options, you're not sure what they are, and you want a simple step-by-step guide to understanding them and getting started with them.
I have no idea if options are even right for you, but I do promise to show you what has worked for me and the exact steps I've taken to use them to earn additional income, protect my investments, and to experience freedom in my life.
If you want to learn more, I invite you to downloadaFREE video case study on how to trade options like Warren Buffett.
Inside you will discover...
- How investors pay me money to buy their stock.
- How "combining option selling with option buying" resulted in a 60% growth of my account.
- The "Family Freedom Fund" strategy I use to beat the market each year (I'm an experienced investor so your results may vary).
- And lastly, there is a high risk way to trade options and a low risk way. You'll discover a low risk"sleep well at night" method of investing.
Fill in your details below to download your FREE case study. Along with your case study, you'll also get my daily emails where I share my favorite option trading strategies, examples of the trades I'm currently in, and ways to protect your investments in any market.
Wealth Building Resources
Free Video Case Study (Newsletter)
MarketClub (Stock Trading Software)
Options Trading Made Simple Book (Kindle book)
MarketClub Options (Budget Friendly Training Program)
Free Options Course Learning Modules
Learn Stock Options Trading Home Page
Trader Travis's YouTube Channel
Misc. Articles
hilliardableavoing.blogspot.com
Source: https://www.learn-stock-options-trading.com/stock-volume.html
Post a Comment for "What the Average Volume of a Stock Tells You About How Easy It is to Offload"